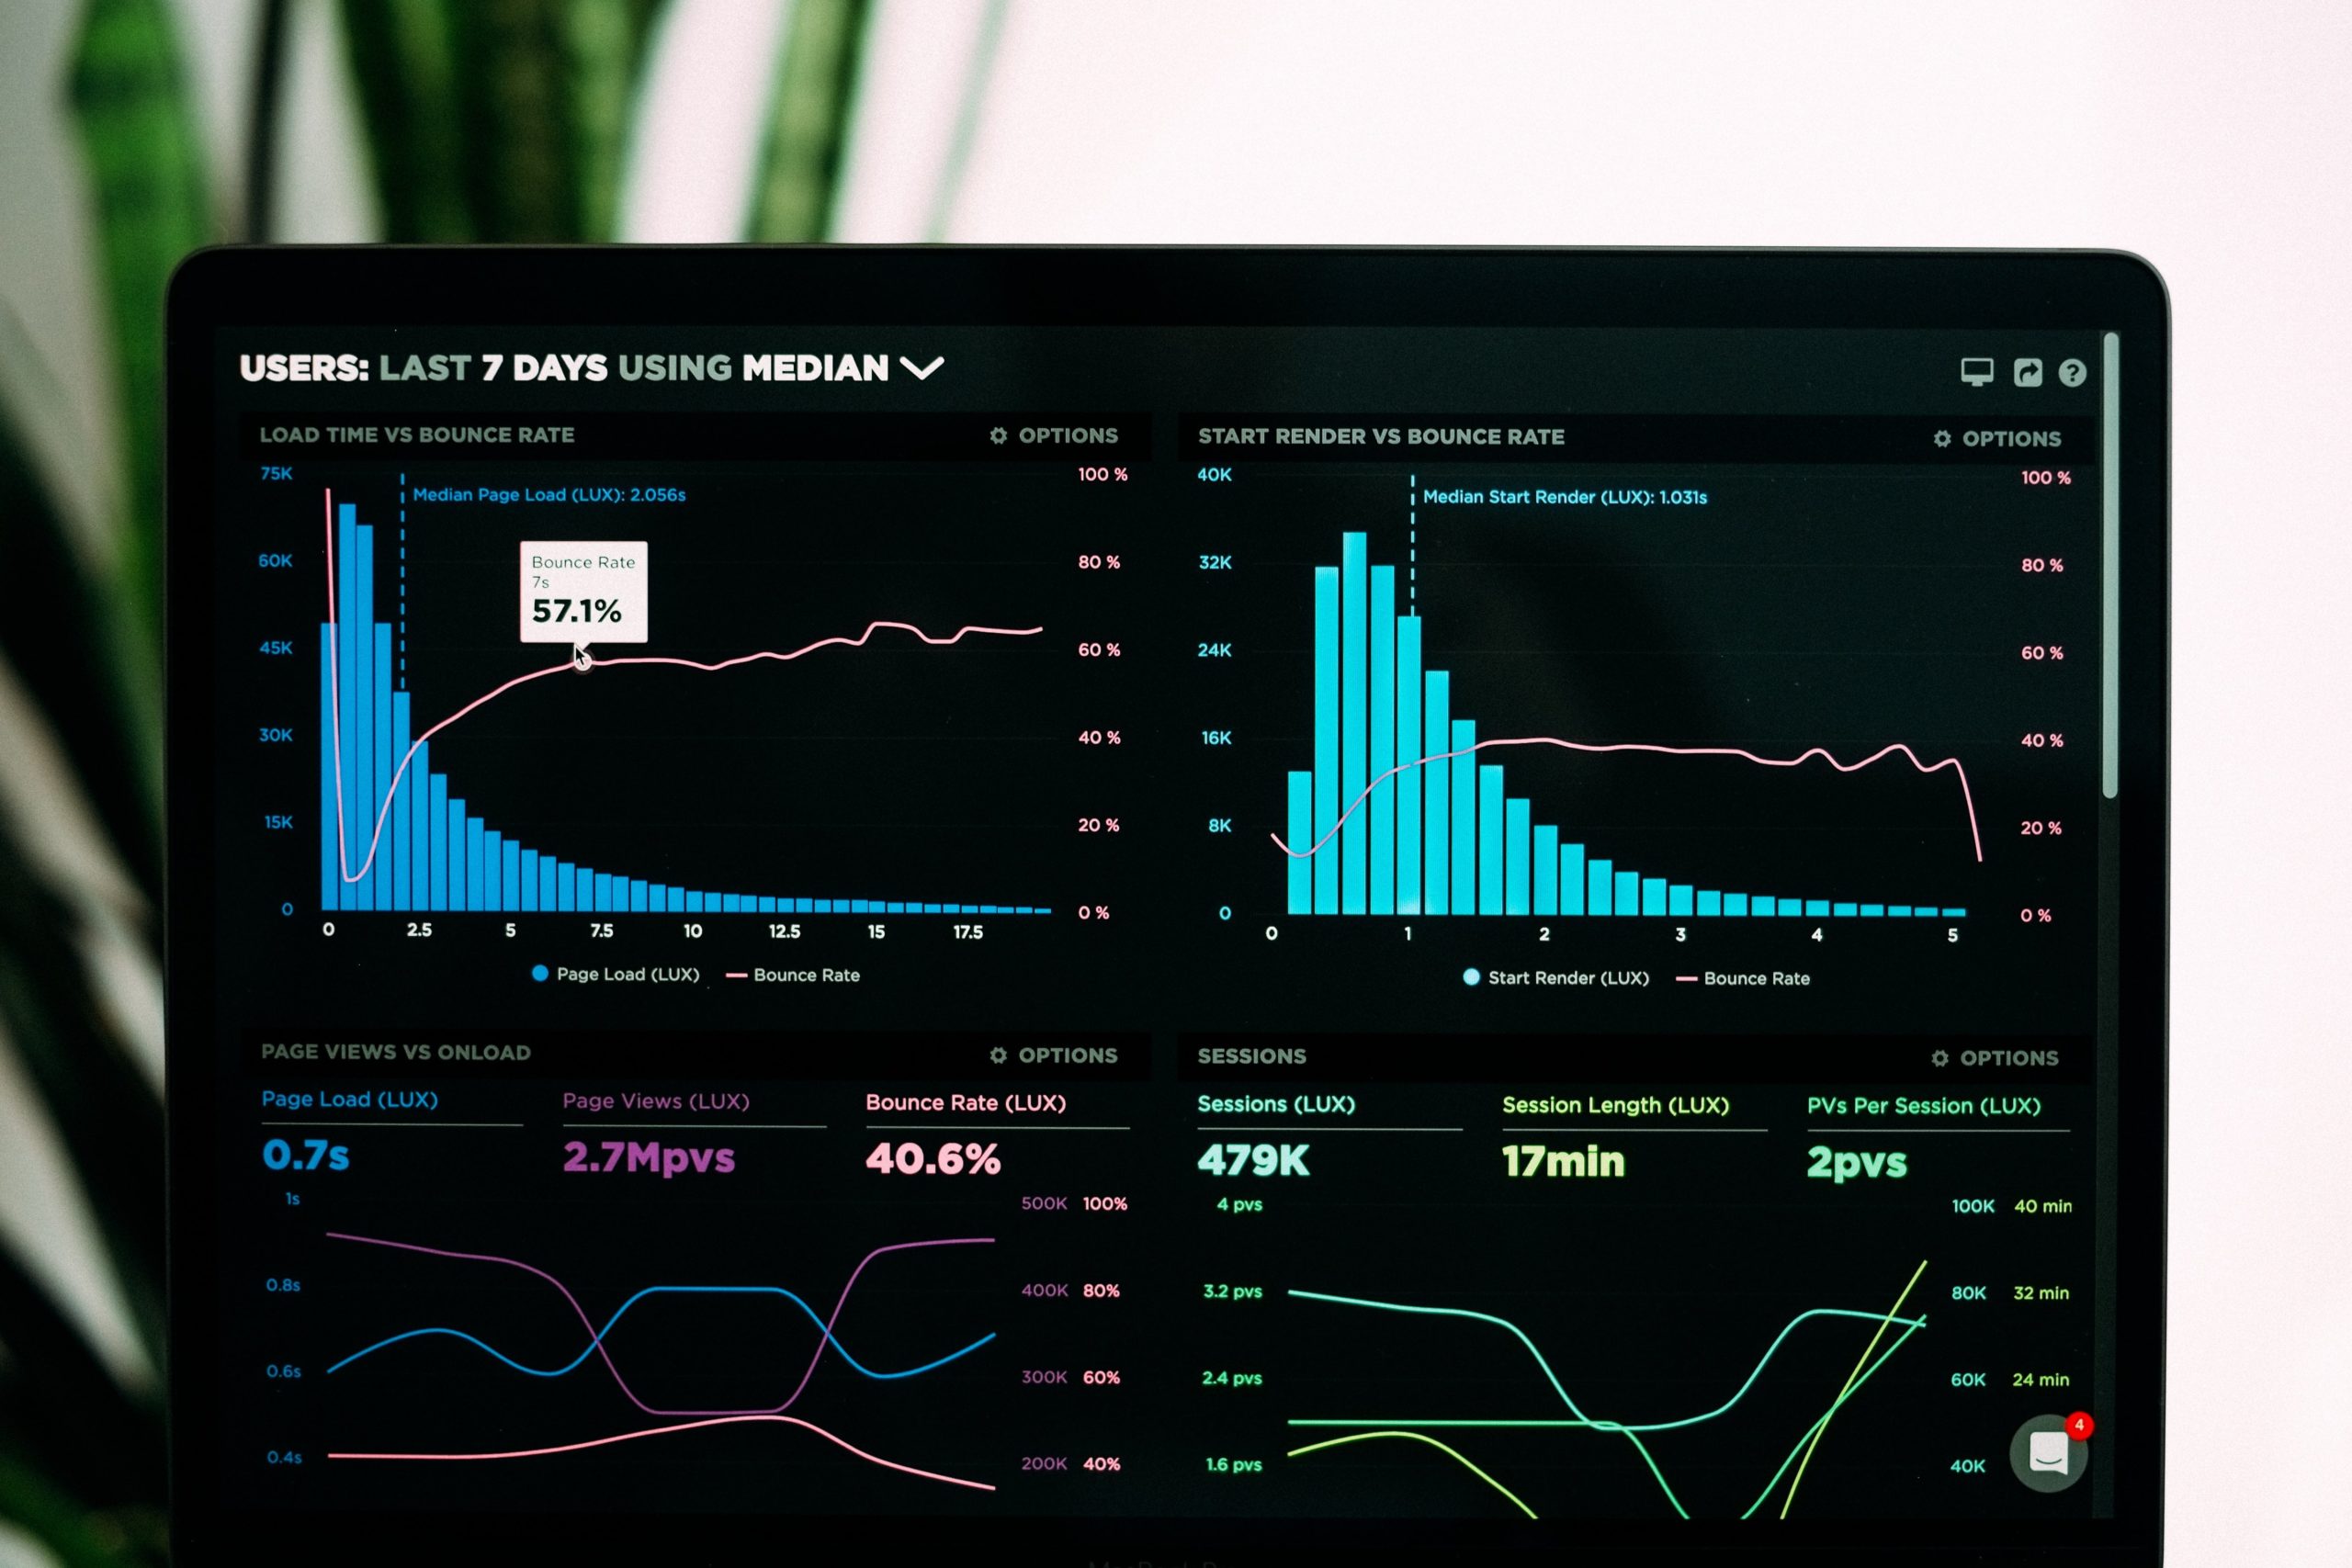
How To Create Gorgeous Charts & Dashboards
One of the most in-demand skills in today’s job market
Our Best Resources
Free Download: The Ultimate Guide To Creating Excel Dashboards
Even if you don’t know anything about building dashboards, this guide will get you up and running in no time
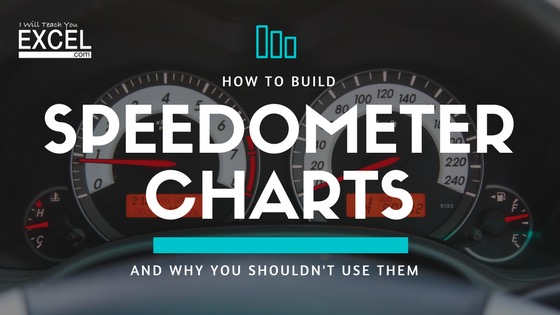
Free Download: How To Build a Speedometer Chart
Speedometer charts can be an effective way yo illustrate important information. Learn how to build one, and when NOT to use them in your dashboards.
Excel Dashboards Quickstart Guide
Building a dashboard is more than just throwing a bunch of charts and graphs together. Learn the fundamentals of a making a useful dashboard.
Latest Blog Posts
How To Build Gorgeous Speedometer Charts and Why You Shouldn’t Use Them
The argument for and against using Speedometer Charts I’ll first state that no matter what you read online, whether on this site or on another,…
Read More How To Build Gorgeous Speedometer Charts and Why You Shouldn’t Use Them
Dashboards Your Boss Will Salivate Over: Ultimate Guide
How to create Dashboard that your boss will absolutely salivate over like a chihuahua on a hot summer day! Imagine being asked to provide senior…
Read More Dashboards Your Boss Will Salivate Over: Ultimate Guide
9 Excel Business Model Sins You Must Avoid At All Costs
There are unwritten rules in the Excel world that you may not know about… Whether you’re aware of them or not, they exist and most…
Read More 9 Excel Business Model Sins You Must Avoid At All Costs
15 Awesome Tips That Will Make You an Excel Analysis Wizard
Imagine yourself becoming the go to person when it comes to business analysis at your company… Becoming so intimately knowledgeable of your company’s operations that…
Read More 15 Awesome Tips That Will Make You an Excel Analysis Wizard
Charts and Graphs – Make your data stand out
I noticed a huge change in my audience’s reception to the way I presented my analysis once I began incorporating more charts and graphs into…
