There are unwritten rules in the Excel world that you may not know about…
Whether you’re aware of them or not, they exist and most experienced Excel users know about them.
I, like most people, learned about these things the hard way. Many stress-filled late nights at the office, pulling my hair out and wanting to slam my computer against the ground.
In this post I’ll share with you the 9 Excel Business Model Sins that I’ve committed and, at one point or another, have all but ruined my career.
Not only will this post help you avoid the same mistakes I’ve made, but it will also help make you a much bigger contributor to your company, even if you don’t ever do any data analysis or modeling.
Sin # 1: Not being organized from the beginning
In order for your model to work effectively you need to set it up the right way from the beginning. Most people tend to just open up Excel and start writing formulas and copy/pasting data but doing this could lead to a few headaches.
Setup your sheet to (a) organize yourself in a way that will minimize any potential tear shedding later (your model can get messy) and (b) be able to allow yourself to easily audit your work.
The proper way to do this, typically, is to create the following tabs (or some variation of them):
Input/Assumptions Tab
This sheet will serve as the starting point of your analysis. I like to think of it as my command center where I have all my levers and buttons to push and pull in order to run different scenarios through my model. If you are listing assumptions, make sure there are sufficient notes (more on this later).
You can also use it as your “data-dump” tab(s) where you import raw data from your database and begin using it in your model through the formulas you build. This should act as a template; drop it in and let the model do its work.
Calculations Tab
As the name suggests, this is where you will be doing all your calculations from. This sheet should only contain formulas and should serve to transform your inputs into meaningful insight and analysis.
Output Tab
Your actual model will live in this sheet and display what the outcome was. I tend to obsess over formatting and making analysis self-explanatory (I don’t always succeed in that though) so this sheet is usually what I present to management or clients.

Sin # 2: Not color coding your cells
Have you ever been working on an important report (doesn’t have to be a model, although it could be) and you stop to update a cell datapoint but realize that in the sea of values you don’t remember where your hard coded ones are? After a while it all tends to blend in together.
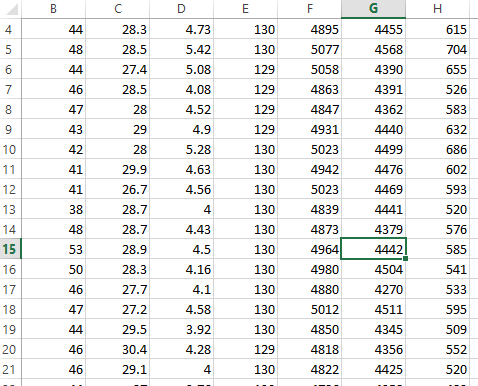
One of the most important things you can do in a model is to color code different types of data. This tip alone can save you lots of time updating and auditing your sheet later (and helps people understand your model better).
For hardcoded values I tend to color the cell background light blue (sometimes I’ll also use a dark blue font). I usually leave cells containing formulas unformatted. I would also use different color schemes to indicate actual vs. forecasted numbers (if I’m working on a financial model).
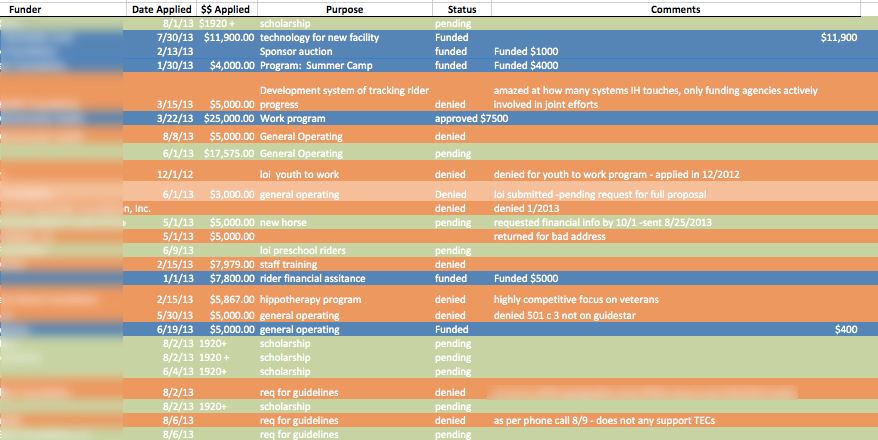
Play with whatever works best for you, there really isn’t a “right way” to color code your model as long as it is clear to you. The key is to know your audience and understand what questions they’ll probably ask you if they were trying to understand your model. Then answer those questions before they come up by using colors to indicate different types of data and their source.
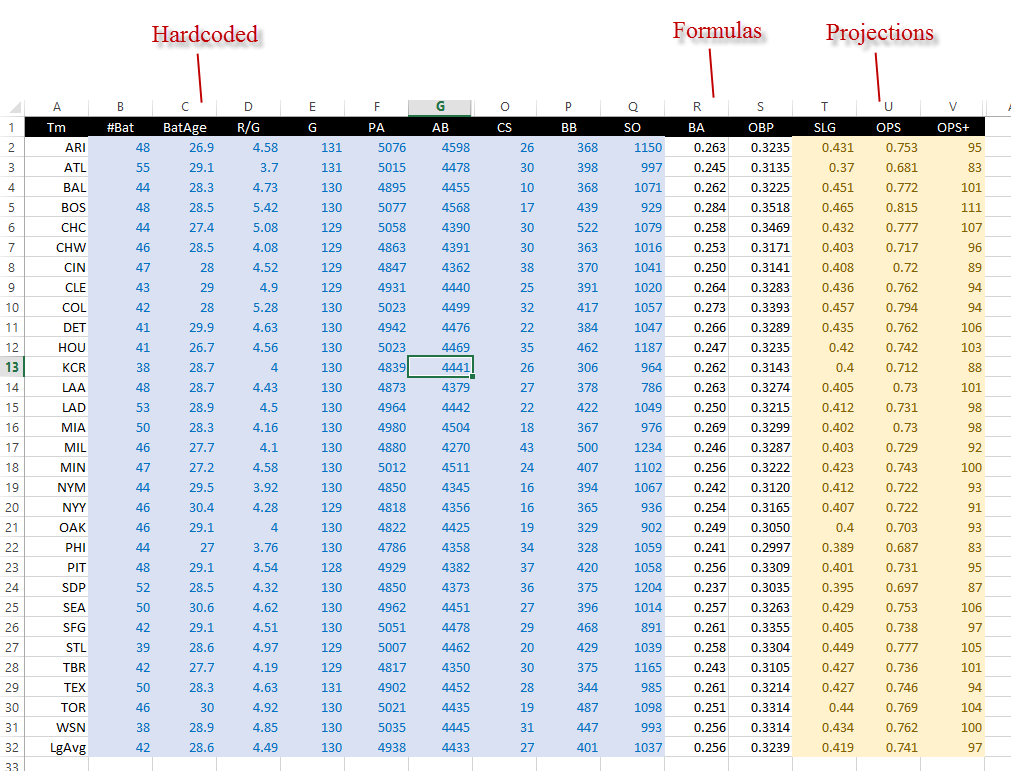
Once you have a color coding system in place, don’t forget to include a legend to indicate what each color means. Otherwise, your model might resemble a bowl of fruit loops.

Sin # 3: Not Commenting aggressively and indicating units explicitly
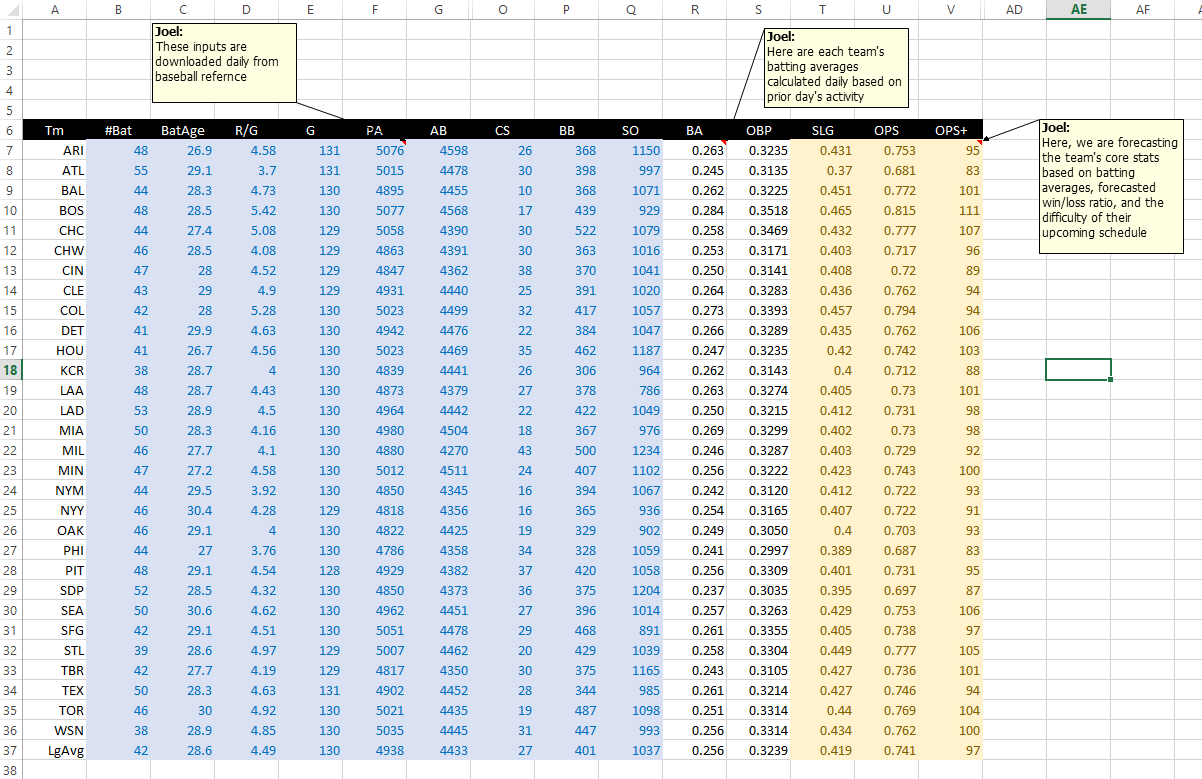
There is so much thought, logic, and assumptions that go into making a model work that they can probably be accompanied by an instructional manual. Since you probably don’t have the time to create a full-fledged instructional manual, the next best thing is to add as many comments as you can and to indicate units explicitly.
Many people avoid doing this because:
“My models are pretty self explanatory”
“It’s common knowledge”
“It’s pretty straight forward”
“Anyone who works in this company will understand the majority of what I’m trying to portray”
Wrong.
Ask a Ford engineer to explain how a Mustang’s engine works and they might use similar language. Ford still includes user manuals with their cars; don’t they?
By over-commenting, not only will your stakeholders understand your model better (and, as a result, will ask better questions and get more insight from you) but it will show others that:
- You know what you’re talking about
- You are thorough enough to answer people’s questions before they even come up
- You have the unique skill of being able to present the data in addition to crunching and analyzing it (crunching numbers is half the battle)
If you want to take things to the next level, don’t be afraid of showing comments to your user (as long as it doesn’t crowd up the sheet). This can add another level of detail to your model that can separate it from others.

Sin # 4: Not building error checks or controls
The most important word in any profession is credibility. One mistake, even an honest one, even one that others deam reasonable for someone to make, may destroy your credibility. Once someone catches a mistake they begin to question everything else in your model and are likely to ask more questions during a presentation (or worse, just discredit the entire model completely).
Error checking is one of the most important aspects of building a model, if not, then more important than the model itself.
Obviously, every model is different so there isn’t a “one-size-fits-all” solution to making sure the error checks are built in, but here are a couple that have worked for me:
Use a pivot table: One of the easiest ways to double check your own work, albeit very manual, is to build a pivot table and compare the results to some of your model’s outputs. SUMIFS are one of the easiest Excel formulas to mess up because the more criteria you use, the more difficult it becomes to keep track of them. A pivot table can help make sure you didn’t forget to include/exclude a criteria from your total.
Some people have multiple input/calculation sheets for good reason. This also leads to errors. Make sure you’re bringing all of the data you intend to use over from one sheet to the next by using totals in each of them and making sure those totals zero out. I’ve caught many mistakes by just totaling up what I should have vs. what I actually have.

Lastly, when building a database for your model make sure you convert your database into an Excel table (highlight your data and hit Ctrl + T). By using an Excel table (rather than just entered in a set of columns and rows) the table reference will update whenever you add or delete data onto it. Meaning, no more going back to update your cell references if later you add a ton of data to your sheet, and less chance of errors.
Learn More About Excel Tables Here
Sin # 5: Not making all your formulas dynamic and easy to update
This tip builds on the first one of making a separate sheet for calculations. Make all your formulas as dynamic as possible. This means you are able to drag them horizontally or vertically without a hitch; the last thing you want to be doing is manually updating your formulas.
Never hard-code any value into a formula; try to always use a cell reference (this is why we have an input sheet).
It is equally as important to keep your formulas as simple and short as possible.
You may think long, complicated looking formulas impress others and make you look like a genius, and you’d be right
On a side note: Most people are impressed by long formulas. It’s almost like performing magic in the office. Here is what your co-worker’s reactions will be to your Excel prowess…
…anyway…
Long formulas aren’t practical because they are increasingly difficult to debug or audit, especially as time passes and you forget.
Use helper cells to break complicated calculations into smaller steps. However, sometimes long formulas are necessary. In those cases…
Use named ranges to make it easier for you to decipher long formulas later (or just make references to an Excel table, see Sin # 4).
Sin # 6: Not preparing the file for presentation to others once the model is complete
So, your model is complete. Congratulations, you’re done!
… just kidding.
We still have some important things to get to.
First, Excel by default shows the grid lines. Hide them, your model will look cleaner and more organized this way. Don’t believe me?
See for yourself:
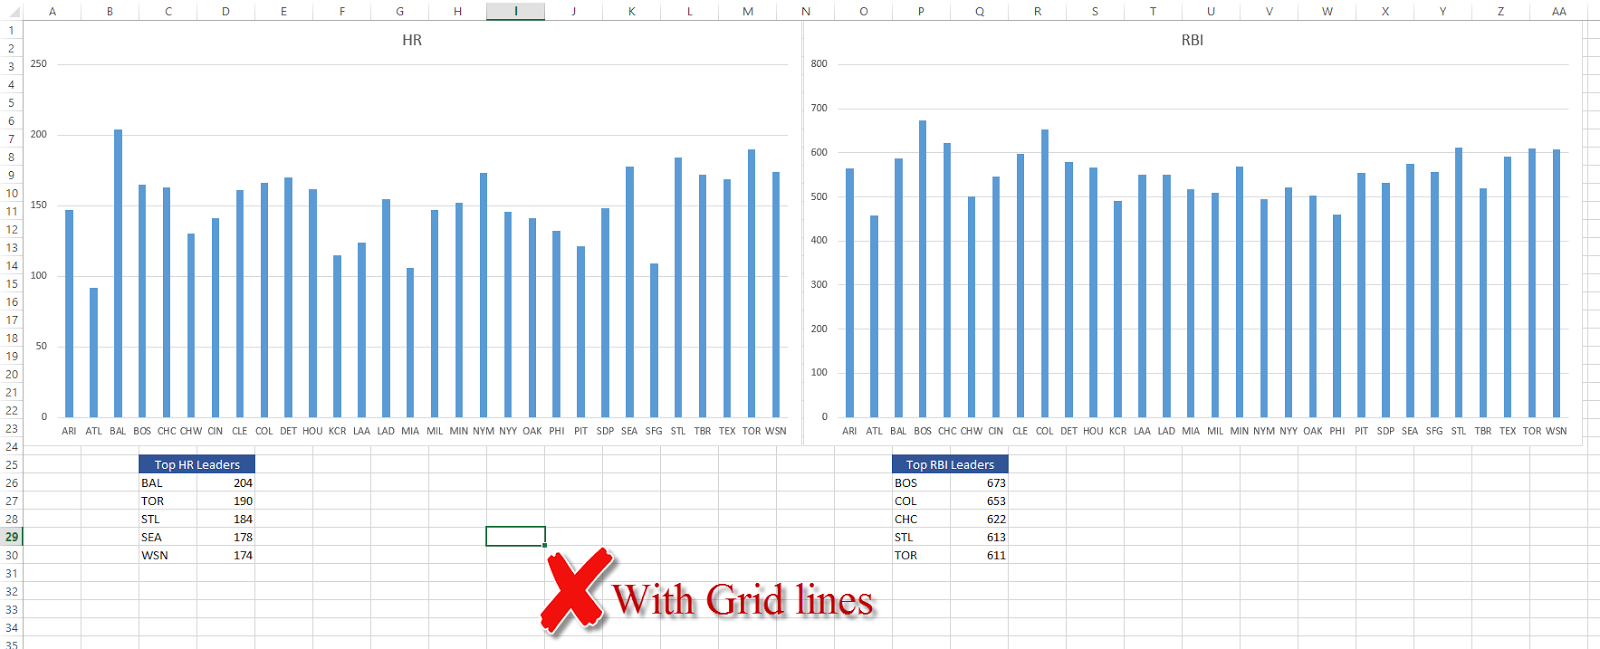
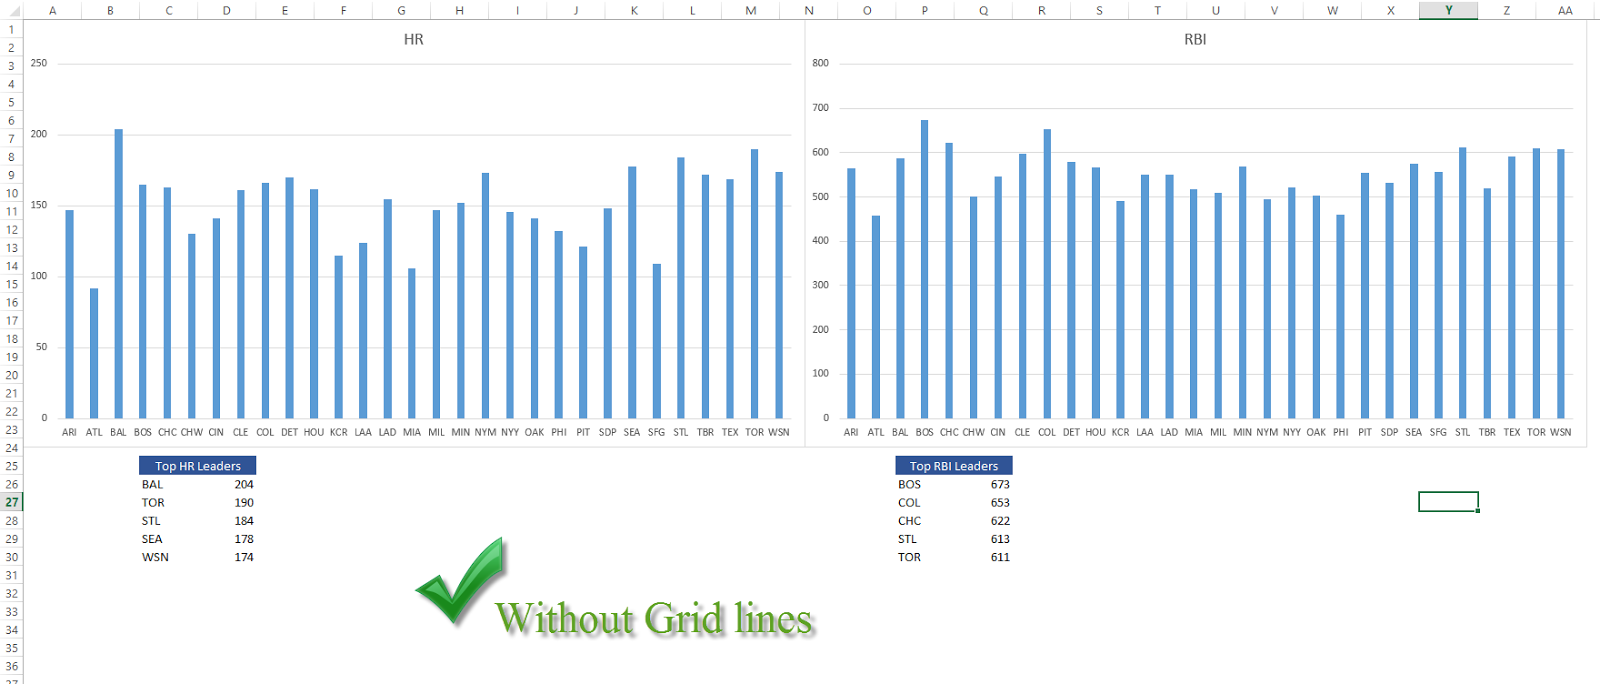
Next, password protect important sheets and cells: cells with formulas, hard-coded values and/or assumptions. Essentially, you’d want to protect anything that, if accidentally modified, would compromise the validity of your model.
Learn More About Password Protection
If you’re the only one using the model, still password protect core cell ranges to ensure you don’t unknowingly change something. I’ve shot myself in the foot many times in the past for skipping over this step.
Sin # 7: Not understanding your model
I have a confession that not many people know about. My dream is to fly an airplane some day. Being a licensed pilot has intrigued me for some time. Pilots are masters of their craft; they must understand everything inside and outside of the airplane with such detail that they can probably pilot an airplane blindfolded.
…not like this guy…
This is the level of understanding you must have for your model. Understand it as though your life depends on it (your job might)!
Understand the intricate details behind every number. You must be able to explain how each assumption was made and how it all affects the output, why the model’s results are the way they are and what factors affect the outcome the most.
When you understand your model with this much detail, you can answer almost any question thrown at you intelligently and with confidence (much like a future executive should be able to ;-).
Sin #8: Not including a table of contents
Although it’s important to be knowledgeable, this doesn’t mean you should allow yourself to be pulled in eighteen different directions, answering everyone’s questions.
Answer those questions before they are even asked (this seems to be a trend) by building a comprehensive table of contents.
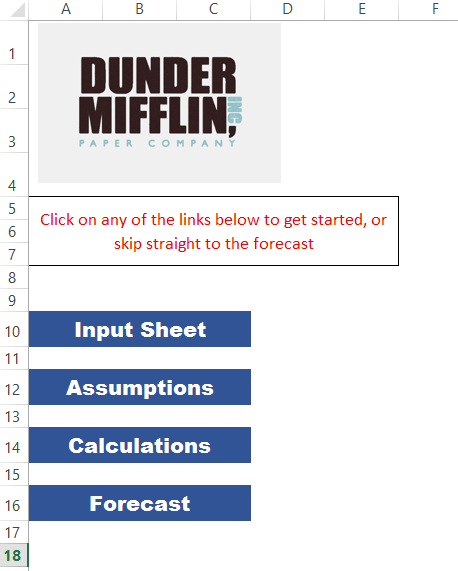
Most people leave this part out, but it could be the most important piece of your model. A good table of contents will have links to each tab (at least the ones you wish to display), an explanation of the purpose of the model and the logic behind its outcomes and assumptions.
For those of you questioning this step; it could prove to be a lifesaver and will help portray confidence and thoroughness to those who see the model. It has an added benefit of saving you time figuring out your own model months later when you need to update it.
Sin #9: Not adjusting the model to your audience
Besides the obvious benefits, knowing your audience has the added benefit of keeping yourself sane. Your audience will determine how far you take your model. If the model is just for you and possibly a few co-workers, you typically only need to worry about it being functional and accurate.
If you are showing your model to an executive or a client, you want to make sure you take it all the way up to visually aesthetic.
Here is what I mean:
Level 1 (Accurate) – You
Level 2 (Flexible, easy to update) – You
Level 3 (Easy to Audit and understand) – Boss
Level 4 (Visually aesthetic) – Client

Oh, there’s one last benefit to all of this; you are going to look like an absolute Excel sorcerer the next time you present because:
- You’re able to field every possible question during your presentation
- Change your model on the fly to account for everyone’s questions and suggestions
- Identify the effects of each change
- Easily discuss those changes and assumptions with any attendee
- Make suggestions of your own to make the company even stronger

What are some things you wish you knew that ended up in disaster? Let me know in the comments section below, you may be saving someone major headaches


Great article, I love the little clips it helps you get the point across, Now how many comments are to many? Also I believe in excel you only see like a red triangle then you know that there is a comment there. Is there a way to keep the comment showing are do people usually go to triangle to get a better understanding? Once again great article.
Hi Anthony,
These are all great questions, thanks for asking. I don’t think there is a such thing as “too many” comments as over communicating probably isn’t worse than under-communicating to your audience. It all depends on your audience; if it’s someone who is pretty savvy in your field and can work their way around Excel then you may need less comments than someone who is new to excel. Also, you’re right when there is a comment the cell in Excel displays a red triangle, but there is a way to show comments all the time. All you have to do is go to the review tab in Excel and select the option that says “Show all comments” . Excel will display all the comments in a sheet and point to the cell where the comment came from.
I hope this helps
-Joel Villar
Thanks Joel. This is very helpful.
Although I’ve been using Excel since the beginning of time, I’ve always had the sneaking suspicion that there were some fundamental things I could be doing to make my Excel projects better. You can only learn so much from Excel Help. They don’t teach you the concepts you’ve so clearly laid out in this article. I already do many things right which is reassuring but Sin #1 is where I generally run into problems because I tend to plan as I go. Your idea of keeping Inputs, Calculations, and Outputs in separate sheets makes a lot of sense. It’s a less cluttered approach and I will definitely start organizing my projects that way. I’ll also be putting more checks in place to ensure accuracy. I’ve been in exactly the situation you described where someone else finds an error in my results and I feel like they don’t trust anything else in the model. Thanks for the great article.
Do you have any thoughts on when to use Pivot Tables vs Access vs Excel Databases (DSUM and SUMIF formulas)?